- TradrLab
- Posts
- How Statistics Prevent Losing Trades
How Statistics Prevent Losing Trades
The difference between blowing your account and making £££
Matthew Enubuje
April 09, 2024

Imagine you own a store.
There’s a product you have that costs £200. There are only 10 in stock. One day, 100 people came and bought them – now it’s sold out.
You’re now doing an inventory purchase for that product.
How much quantity of the product do you buy to replenish stock?
You can take a safe approach and buy between 1-100 but what if over 1000 people want to buy it next week? That’s money lost on the table.
You can be optimistic and buy 1000 but what if nobody wants to buy it next week? That’s a £200,000 loss!
Here’s what a shop owner would do: They will use statistics from various sources to decide stock.
In pure systematic fashion, they would conduct demand forecasting, inventory analysis, budget consideration, competitor analysis, and more.
How does this relate to trading?
In the same way shop owners use stats to purchase stock, traders should also use stats to influence their trading decisions.
And stats in trading are more crucial than you think due to this…
We’ve all been lied to when it comes to trading.
Most things we think are true are very questionable. The worst part is we’re told we lose because of psychology but that’s a half-truth.
What do I mean?
The information published about candlesticks, indicators, and chart patterns just isn’t true (I’ll prove this in a second).
We’re so convinced it’s true we dress up the lies by compounding them together until we find something working to prove our biases — instead of looking at the root cause.
And guess what? The people who originally put out trading information did so in good faith and were often right! So why are they wrong now?
It’s because markets evolve.
In the past, you could get away with solely using strategies like RSI, bullish engulfing, and Fractals by Bill Williams.
Today it’s a recipe for disaster. The markets have updated and have gotten more competitive.
It’s no longer safe to rely on hearsay internet information as it may be outdated.
The best chance of success is relying on data.
Now as promised…
An example of a common trading belief being proven false
If you’re familiar with chart patterns, you would know that some are bullish and others are bearish.
If I asked most traders what a bullish engulfing is, they’d say bullish.
This isn’t always true!
Here’s a statistical price action breakdown of a bullish engulfing pattern on EUR/USD on the 5-min chart:
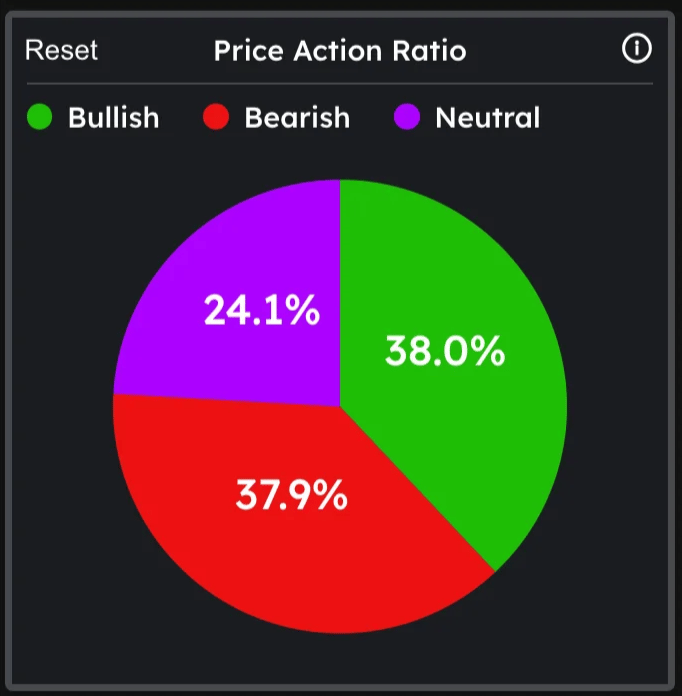
A statistical analysis using the Tradrlab beta.
It goes up 38%, down 37.9%, and is neutral at 24.1% — a bullish engulfing is the equivalent of a Doji candlestick pattern on EUR/USD.
You might think it’s just an anomaly with the 5-min chart, but it’s almost the same results on the 10-min, 15-min, 30-min, and 1-hour chart.
Now do you see why you can’t trust information that hasn’t been validated?
Can you also see why trading psychology isn’t always the fix to unprofitable trading?
The trading markets have evolved to a stage where a truth 10 years ago might be a lie today.
Knowing the stats of your market and strategy is the best way to ensure you’re not following false info.
It costs too much money to not use statistics in trading.
Interested in discovering stats about your trading market and strategy?
If you haven’t already, register your interest for the TradrLab beta by signing up here: https://tradrlab.com/
See you guys soon!